As a part of MarkLogic Consulting Services, we have a Center of Excellence that serves to build up companies’ knowledge and skills around MarkLogic. One of the common issues we see people run into when learning MarkLogic is how to isolate queries—to run a query outside the context of a complete application. You typically want to isolate a query and make it repeatable because of performance issues. Since it’s a performance issue, it likely means you need to fix it fast. This blog post should help you through the first steps of fixing a performance issue, by isolating the query or set of queries that are the problem.
Issue is Currently Happening
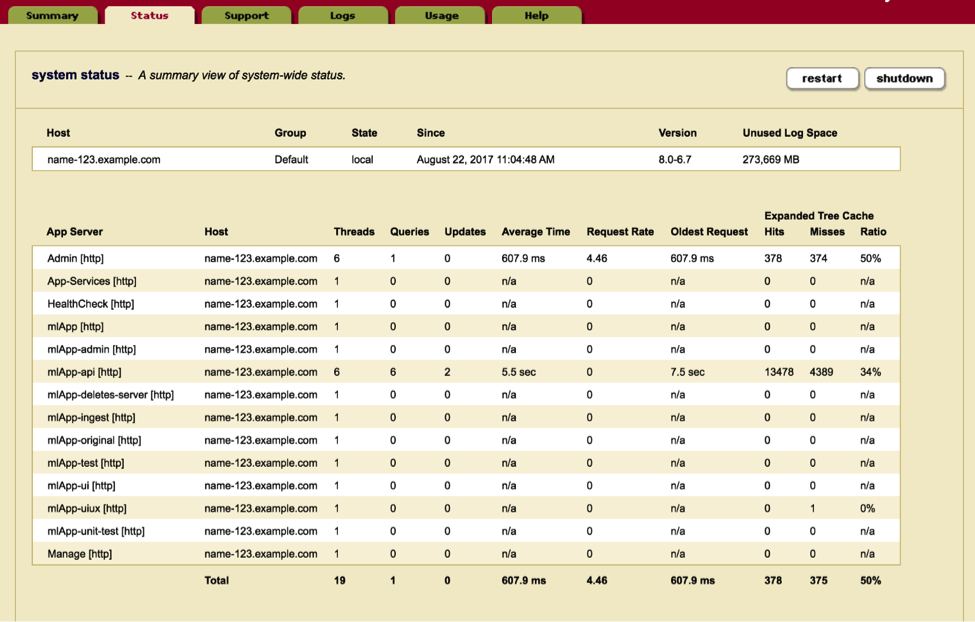
You know something is running slowly on MarkLogic, but you are not sure what is running slow or what to do about it. There are two different paths to take depending on the timeliness of your response. The path that we are going to go over first is if the performance issue is currently happening. A MarkLogic cluster can have many app servers on it; at this point you might not know what application is running slowly on your cluster. In order to find this out we can simply go to the Admin UI at port 8001 and go to the cluster status page (http://<your-server>:8001/cluster-status.xqy). This page shows you a list of all the servers and “Oldest Request” or in other words longest request. You’ll want to look for the server that has the longest request or the highest “Average Time”.

Figure 1: The Admin UI’s cluster status page
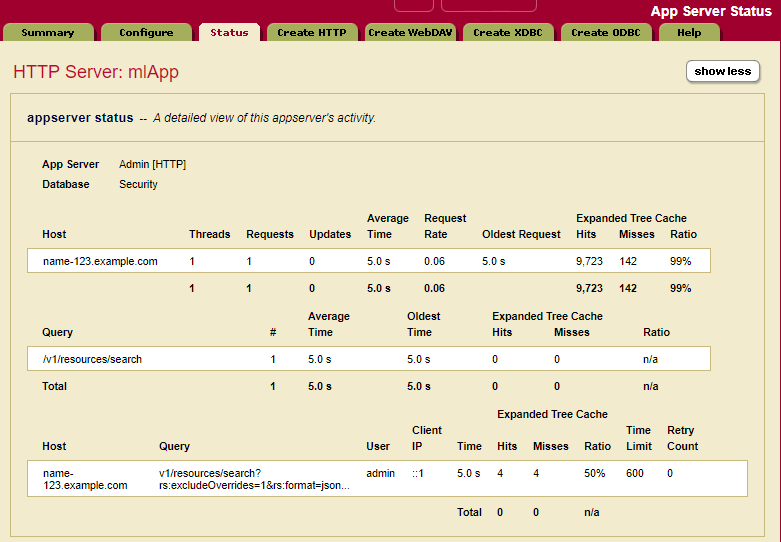
Once you’ve found the application server that has the long running query you want to isolate, click on that app server’s name in the UI. This will bring you to a new page that will show all the queries that are running on that application server. You’ll need to hit the “show more” button on the top right of the page. Once this is hit you’ll be able to view the full query path (if it has “…” just hover over it to get the full path). What we want to do is find all the inputs that happened in order to rerun this query in Query Console. Most of the time the query gives you enough information to do that. If you don’t get enough from the path, such as needing the request body for post or put requests, try the [stack] link. It will show up if you are viewing the Admin UI from the same host as the query that is running.

Figure 2: The App Server status page gives information about currently running requests.
Issue Happened Already
The other path is taken when the issue happened already. We can’t use the Admin UI because that shows activity that is currently happening. What we can do is use some tools that are shipped with MarkLogic and one that MarkLogic Consulting Services has developed. We still have the same end goal of finding the query or set of queries that are creating the issue and then getting the inputs to those queries, so that we can recreate them.
You can start by using the Monitoring History tool. You can get to this tool by going to port 8002 and clicking on the monitoring entry in the menu and selecting the history link. (http://<your-server>:8002/history/). This tool can help you narrow down the timeframe that you need to look at. You’ll want to look for spikes in the graph. The Tool breaks down the resources into sections. A good section to start is the servers section. When viewing the graphs try to keep the “time span” to a 24-hour span (there is a shortcut for 1d that makes this easy) and set the period to “raw”. This will give you a more granular view of the data. Each line on the graph is an application server.
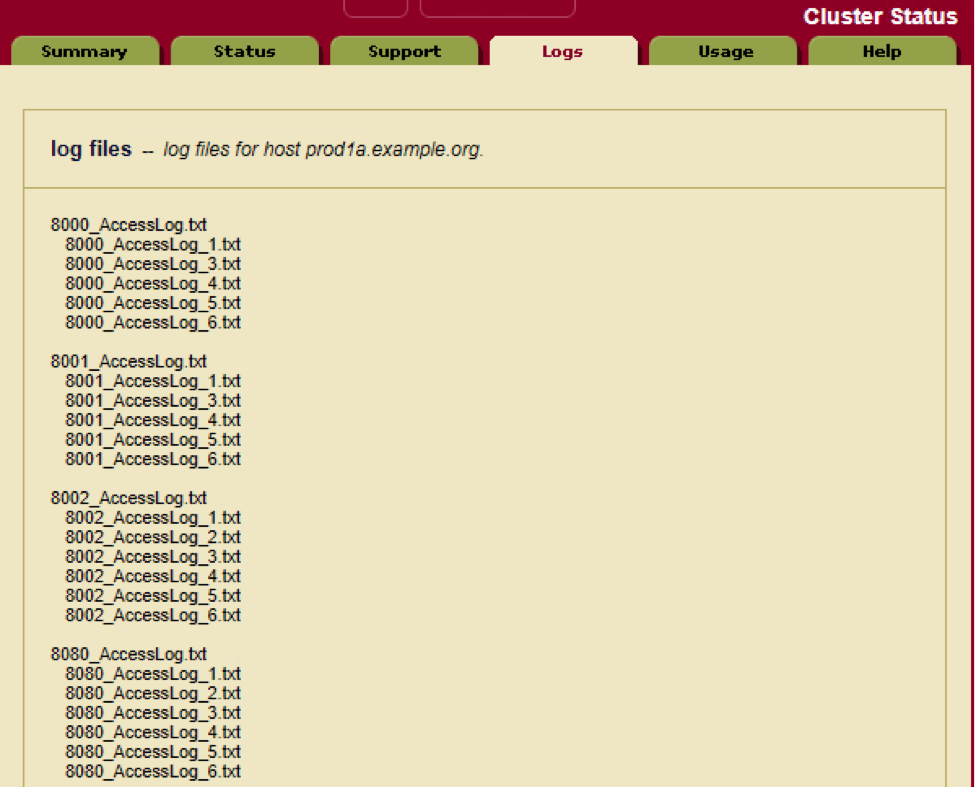
Once you have found the timeframe you want to look up and the application server that was running the query you’ll want to view the access logs for that time frame. By default, MarkLogic keeps the logs for 7 days. It’s a good idea to have those logs going to a monitoring tool, which will allow you to look further back. The logs that are kept by MarkLogic can be viewed from the admin UI on port 8001 by clicking on the logs tab (http://<your-server>:8001/error-logs.xqy). These files can be quite big so its a good idea to download these files and work with them inside some text editor.

Figure 3: The logs tab provides links to all available log files.
Once you have the file downloaded and brought up in a text editor, you’ll want to get to the timeframe in question. The access log appends requests so the older requests will be at the top while the more recent requests will be at the bottom of the document. There is a date time stamp on each line that can be used to filter down the lines you have to look through. Once you have the timeframe you are wanting to review you’ll need to comb through the results until you find the request or queries you want to review. You can then get some of the inputs from the query string. This will not have the post or put payloads. You might be able to find those in the error logs with the same time frame.
::1 - - [29/Aug/2017:16:49:53 -0400] "GET /v1/resources/search?rs:excludeOverrides=1&rs:format=json&rs:howtoTab=false&rs:pageLength=10&rs:q=water&rs:returnAnswers=true&rs:sort=relevancy&rs:spell-correct=true&rs:start=1&rs:structuredQuery=%7B%22query%22:%7B%22queries%22:%5B%7B%22and-query%22:%7B%22queries%22:%5B%5D%7D%7D%5D%7D%7D&rs:tabName=All&rs:weightFile=weights HTTP/1.1" 500 1830 - "Mozilla/5.0 (Windows NT 10.0; Win64; x64) AppleWebKit/537.36 (KHTML, like Gecko) Chrome/60.0.3112.113 Safari/537.36"
Figure 4: Example Access Log
The above approach is time-intensive and gets tedious fast, this is why at MarkLogic Consulting Services we created a tool called Service Metrics. With a minimal amount of coding and overhead the Service Metrics tool can log the requests either to the error log file or a separate MarkLogic database. Based on configuration that can be set at query or “service” level, information will be logged such as the inputs needed to recreate the query.
Once you have the Service Metrics tool setup and a query has run that you want to isolate, you can simply look into the place that you set Service Metrics to log too and search the log for long running queries. If you know the time that MarkLogic was running slowly, you can look at the logs by the timestamp and see the services that were running at that time. You’ll want to take all the inputs for each of the services that you want to look at.
param_2:={"pageLength":"10", "format":"json", "q":"water", "structuredQuery":"{"query":{"queries":[{"and-query":{"queries":[]}}]}}", "tabName":"All", "start":"1", "howtoTab":"false", "returnAnswers":"true", "weightFile":"weights", "excludeOverrides":"1", "sort":"relevancy", "spell-correct":"false"}


2017-08-29 172017-08-29 17:10:26.814 Info: mlApp-api: param(s): 2017-08-29 17:10:26.814 Info: mlApp-api: param_1:={} 2017-08-29 17:10:26.814 Info: mlApp-api:2017-08-29 17:10:26.814 Info: mlApp-api: == query meters == 2017-08-29 17:10:26.814 Info: mlApp-api: list-cache-hits= 155 2017-08-29 17:10:26.814 Info: mlApp-api: list-cache-misses= 291 2017-08-29 17:10:26.814 Info: mlApp-api: expanded-tree-cache-hits= 4 2017-08-29 17:10:26.814 Info: mlApp-api: expanded-tree-cache-misses= 4 2017-08-29 17:10:26.814 Info: mlApp-api: compressed-tree-cache-hits= 2 :10:26.814 Info: mlApp-api: COMPLETED : SERVICE=search_get|10756510426555482222| time=PT5.0512959S
Figure 5: Example of the service metrics output
Recreating the Query
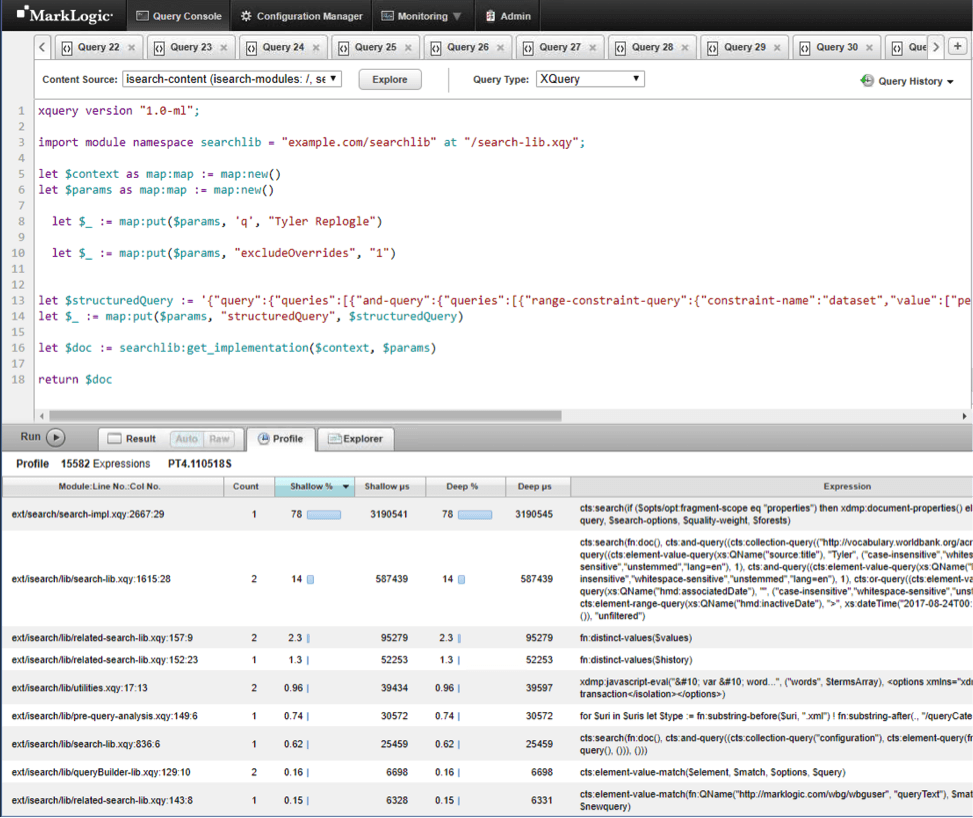
The easiest way to recreate the query is to use Query Console located at port 8000 (http://<your-server>:8000/qconsole) with the inputs captured by the methods above. You will likely have to modify the code by removing http or static variables with hard-coding the captured inputs. You might also have to flatten some library calls into main functions so that you can debug. Once you start using Query Console you’ll start writing your code in such ways where it’s easier to do this. Writing your code so that functionality is in library functions has other benefits such as making it easier to unit test your code as well as better code manageability.
After the code is all cleaned up and you can run it without any errors you’ll want to profile the code. If the slow parts are a query, use xdmp:plan()< or xdmp:query-trace(fn:true()) to better understand the query. You might also want to copy just the slow parts to another Query Console tab and profile it there. If the slow part is a cts:search() check if the query options specify filtered or unfiltered. If it’s filtered see if the query can be resolved through the indexes; if that is the case then you can likely use unfiltered, which will be much faster. You can also remove query portions iteratively and add a [1 to 100] size limit to determine which parts of the query cause unexpected behavior.

Figure 6: Profiling in Query Console
If you profile it in Query Console and it runs fast that could mean that it is only slow under load or that when other queries that run during that time make it slow. You can try running this query with a small number of other queries that ran during that time and see if the query takes longer to complete. This will let you know if there is contention or interactions with those queries.
It should be taken into account that MarkLogic caches a lot when debugging performance issues. A request rerun will most likely be faster the 2nd time around because of caches such as the list cache and expanded tree cache. Clearing the caches on production environments can be tricky, because you don’t want to affect production workloads. If you can bring the issue to a pre-prod environment that has the same data then you can clear the caches by simply restarting MarkLogic. There are some undocumented functions that can clear the caches. Each function clears the cache on the host that it runs on. This means you’ll have to run them on all the hosts that you want the caches cleared on. These functions return an empty sequence; the way to know if they worked is to run xdmp:cache-status() before and after and compare the outputs.
Cache clearing functions:
xdmp:list-cache-clear()xdmp:expanded-tree-cache-clear()xdmp:compressed-tree-cache-clear()xdmp:triple-cache-clear()xdmp:triple-value-cache-clear()
Finally, you’ll want to look for dynamic query inputs. These inputs might not be cached. Static query inputs are more likely to be cached. While running the queries, check xdmp:cache-status(), which will let you know how busy or full the caches are.
Next Steps
This query isolation process of finding out what query was running slowly, getting the input in order to run that query, and then recreating the query in Query Console, can also be used for debugging and reproducing errors. This is only the start though, you will have to write the code or change database settings to get better performance. Also, this blog post just scratched the surface of what can be done in order to find out why the code was running slowly. Below are some resources that can be used in order to further understand performance in MarkLogic.
- Performance: Understanding System Resources – This is a white paper that talks about all the resources that MarkLogic uses
- MarkLogic Consulting Services Center of Excellence Service – This is the offering that I talked about the start of the blog post creates experts within your organization who will ensure you get the fullest value out of your MarkLogic technology investment and the tools and processes needed to support them.
- MarkLogic Consulting Services Performance Health Check Service – There is also a performance health check offering that MarkLogic Consulting Services can perform where we can assess the code and fix issues.
- Query Performance and Tuning Guide – This is a guide that walks you through basic query tuning capabilities of MarkLogic.
- Technical Workshop: Performance – There is a new course at MarkLogic University that goes over many ways to make queries more performant.
- Service Metrics tool – Customers who are working with MarkLogic Consulting Services have access to this tool. Contact MarkLogic Consulting Services if you’d like use it.
- A Checklist for Optimizing Query Performance – Blog post listing several things to check to ensure good query performance.
Tyler Replogle
View all posts from Tyler Replogle on the Progress blog. Connect with us about all things application development and deployment, data integration and digital business.
Comments
Topics
- Application Development
- Mobility
- Digital Experience
- Company and Community
- Data Platform
- Secure File Transfer
- Infrastructure Management
Sitefinity Training and Certification Now Available.
Let our experts teach you how to use Sitefinity's best-in-class features to deliver compelling digital experiences.
Learn MoreMore From Progress
Latest Stories
in Your Inbox
Subscribe to get all the news, info and tutorials you need to build better business apps and sites
Progress collects the Personal Information set out in our Privacy Policy and the Supplemental Privacy notice for residents of California and other US States and uses it for the purposes stated in that policy.
You can also ask us not to share your Personal Information to third parties here: Do Not Sell or Share My Info
We see that you have already chosen to receive marketing materials from us. If you wish to change this at any time you may do so by clicking here.
Thank you for your continued interest in Progress. Based on either your previous activity on our websites or our ongoing relationship, we will keep you updated on our products, solutions, services, company news and events. If you decide that you want to be removed from our mailing lists at any time, you can change your contact preferences by clicking here.


