MarkLogic provides a variety of ways to make monitoring and managing MarkLogic easy. In this tutorial, we’ll give you a quick overview of each of them, and talk about how they can fit into a bigger monitoring picture. But before we begin, let’s take a quick detour to the scene of a potentially disastrous administrative scenario.
The Inside Story
Meet Jill and Ted. They’re both experienced database administrators, but they’re very new to MarkLogic Server. They’re working with a team of developers who are in a mad dash to get their first, mission-critical, application up and running.
Jill and Ted are smart and they’ve got some basic principles under their belt. For example, they know that storing data requires adequate space on disk to accommodate merges. They’re working on getting monitoring tools and scripts in place, but in the meantime they’ve let developers know that they should check in before starting to bulk load data on the staging cluster. And since they’re the only ones with administrative credentials for that cluster, they’re also answering lots of questions about index settings and other configuration details.
Jill goes skiing on a Saturday, and runs into a tree; she’s out of commission for a while. Ted is scrambling to keep up with the demands and get the necessary monitoring tools in place. But company security policy prevents him from giving anyone else the administrative role, since administrators have access to security settings.
What can Ted do to get monitoring in place faster in Jill’s absence, and make the developers more self-sufficient?
Built-in Tools
Out of the box, Ted can enable trusted developers to get status and configuration information that they need on their own. He can simply assign them manage-user role, and direct them to two new tools hosted on port 8002.
Configuration Manager
Configuration Manager provides read-only access to much of the same configuration and status information that he can see in the Administrative Interface, with a few exceptions (like security-related resources).
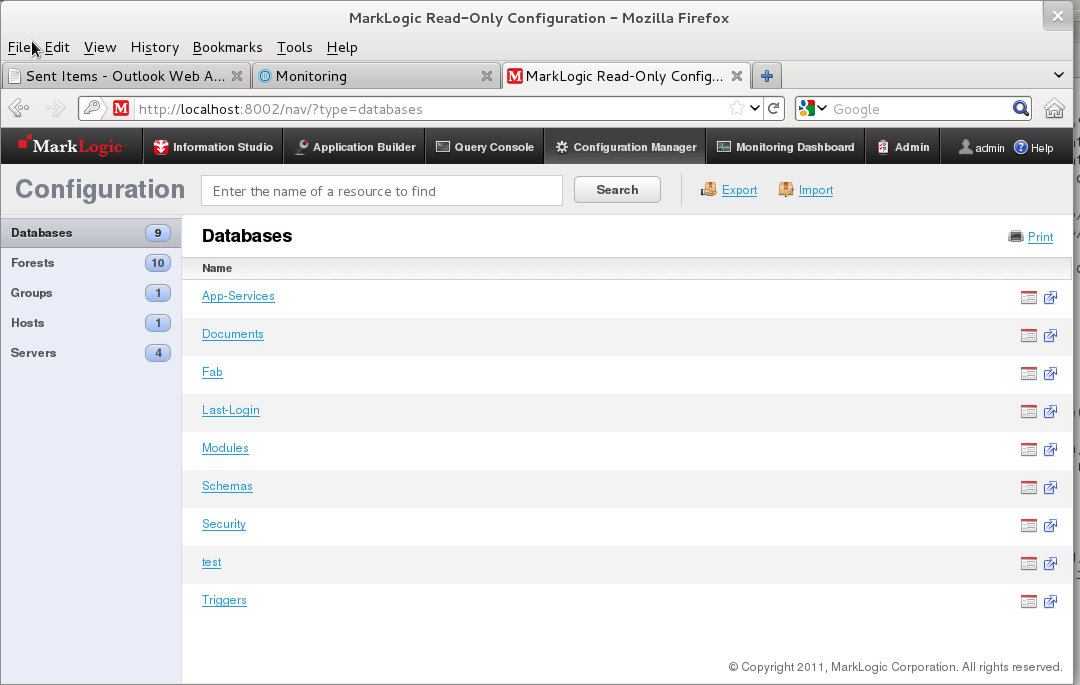
Ted can direct developers to the Configuration Manager if they need information about how the server is configured. For example, they can determine which indexes are configured on a database without having to ask Ted.
Monitoring Dashboard
The Monitoring Dashboard is a lightweight, real-time, task-focused web interface designed around three common sets of questions:
- How are my queries performing? Which queries are running slowest?
- How are I/O rates and loads on my server now?
- How much disk space do I have available, and how it it distributed? Am I running out of space?
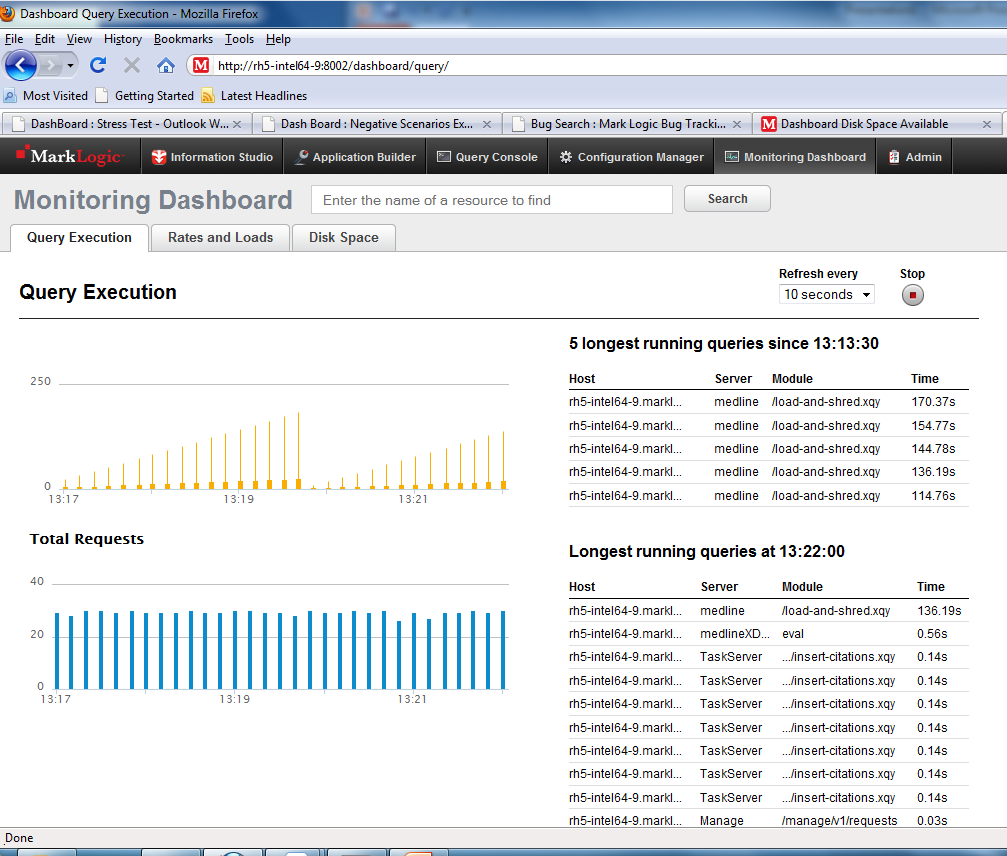
Ted can point his developers to the Monitoring Dashboard if they want information to help them understand activity on the system or if they want to check disk space before and during ingestion.
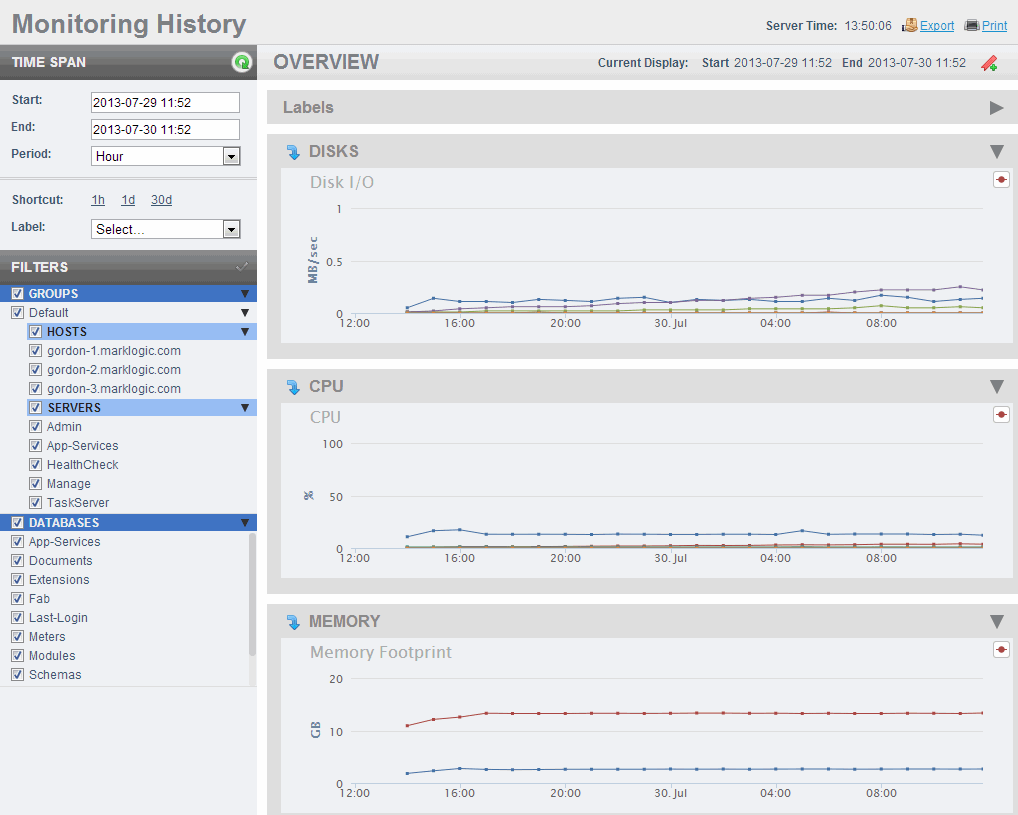
Monitoring History
Monitoring History provides an historical record of critical metrics making it easier to comprehend cluster performance over time.
Before Jill’s accident, Ted and Jill had setup replica forests to enable a local disk failover strategy which will help
make their application highly available, even if things go wrong. Ted wants to test this feature now and would like to work with his operations engineers to determine the impact failover would have on performance, which in turn helps them provision the cluster properly.
Monitoring History allows Ted and the operations engineers to zoom in on the time period they tested failover, alowing the ability to drill down into metrics reporting on:
- Disks- Writes, Query Traffic, Merge Reads, Merge Writes, Backup, Restore
- CPU- User, Nice, System, I/O Wait, IRQ, Steal
- Memory- Memory footprint, I/O
- Servers- App Server Request Rate, App Server Latency, Task Server Queue Size, Expanded Tree Cache Hits/Misses
- Network- XDQP Read, XDQP Write, Foreign XDQP Read, Foreign XDQP write
- Databases- Active/Deleted Fragments, Data size, Lock rate, Database Replication
Ted ‘bookmarks’ the test time periods in Monitoring History, using the handy label mechanism, so when Jill recuperates and comes back to work; she can review, compare and contrast for herself.
Plugin for Nagios
Once he’s freed himself from many of the developers’ demands, Ted can turn his attention to getting a monitoring strategy in place. His first stop: check out an out-of-the-box integration.
Nagios is a popular open source network and system monitoring framework. MarkLogic provides the MarkLogic Plugin for Nagios, an open-source plugin that makes it easy to use Nagios to monitor your MarkLogic Server cluster. A configuration script bundled with the Plugin generates a custom configuration file for the MarkLogic cluster, so set-up is a snap.
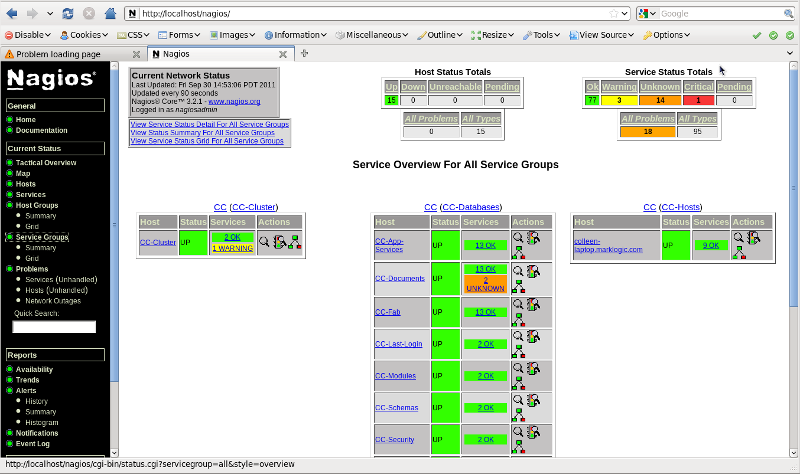
Ted’s in luck, they’re already using Nagios for many of their other monitoring needs. He downloads the Plugin and finds that there’s a handy script to generate a custom configuration file for his cluster. He’s got that running in 10 minutes. He can see that he’ll need to do some customization, set some thresholds, and complement it with a log monitoring tool, but it gives him a running start on many of the core metrics he wants to monitor. In the meantime, if a database starts running out of disk space, Nagios will alert him.
All of the tools described above are built on a single foundation: a RESTful API providing out-of-the-box HTTP access to configuration and status information.
And a RESTful Management API
Back in the office on Tuesday, Jill’s surprised that they’re ahead of the game. She decides to take on a deferred goal: taking snapshots of the application status. With the developers moving forward so rapidly, she wants to be able to do sanity checks on the long-term trend.
In the documentation, Jill noticed that the Monitoring Dashboard and Configuration Manager tools both get their data from a public Management API. She looks up the AppServices database in the Configuration Manager and clicks on the icon for the Management API.
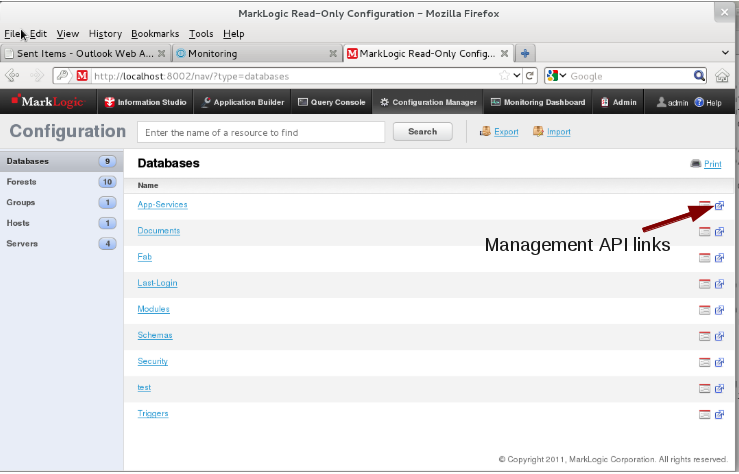
With a few exploratory clicks in the web browser, she navigates to the status for the database and for an appserver that runs against the database. She notices that, as usual in REST, the URIs combine the resource type, the resource identifier, and the represented view. She also confirms that she can get the same information in JSON or XML instead of HTML.
She comes up with a plan. She’ll write her own RESTful client that gets the default page for the database, extracts the list of related appservers, and gets the status for the database and its appservers. All she needs is a tool that can make HTTP requests and store the response documents. That rings a bell, Jill thinks.
She sets up a standalone MarkLogic instance on her laptop and whips up an XQuery script to get and save the aggregated status report as XML. (The hostport is different on Jill’s system, and the musername user has the manage-user role, which provides secure read access to the management information.)
xquery version "1.0-ml";

declare namespace http  = "xdmp:http";

(: the namespace for the database response from the RESTful server:)
declare namespace dbman = "http://marklogic.com/manage/databases";

declare default function namespace "http://www.w3.org/2005/xpath-functions";
declare option xdmp:mapping "false";

let $hostport := "http://localhost:8002"
let $dbname   := "App-Services"
let $options  :=
       <http:options>
           <http:authentication method="digest">
               <http:username>musername</http:username>
               <http:password>mpassword</http:password>
           </http:authentication>
        </http:options>

(: get the database summary with related appservers :)
let $dbrels := xdmp:http-get(
       concat($hostport, "/manage/v1/databases/", $dbname),
       $options
       )
return
   if ($dbrels[1]/http:code/data(.) ge 300) then
       <database-server-error>{$dbrels}</database-server-error>
   (: insert a snapshot for the current date :)
   else xdmp:document-insert(
       concat("/snapshots/",$dbname,"-",string(current-date()),".xml"),
       <database-server-status>{
           (: get the database status :)
           xdmp:http-get(
               concat($hostport, "/manage/v1/databases/", $dbname, "/status"),
               $options
               )[2],
           (: for the appservers, get the appserver status :)
           $dbrels[2]/dbman:database-default/dbman:relations/dbman:relation-group[dbman:typeref eq "servers"]/dbman:relation /
               xdmp:http-get(
                   concat($hostport, "/manage/v1/servers/", string(dbman:nameref), "/status?group-id=Default"),
                   $options
                   )[2]
       }</database-server-status>)
She uses the Admin UI to run the script as a daily task, and now she can search on the snapshots. She’s pleased about that. When she tells her manager, he’s also excited about it, but wants to archive status snapshots with the code in their version control system.
No problem. Jill updates their Perl installation with the LWP and LibXML modules and dives into Perl:
#!/usr/bin/perl

use LWP::UserAgent;
use HTTP::Request::Common;

use XML::LibXML;

my $hostport = 'localhost:8002';
my $realm    = 'public';
my $dbname   = 'App-Services';
my $username = 'musername';
my $password = 'mpassword';

my $useragent = LWP::UserAgent -> new;

$useragent -> credentials($hostport, $realm, $username, $password);

# get the database summary with related appservers
my $response = $useragent->request(GET 'http://' . $hostport . '/manage/v1/databases/' . $dbname);
if ($response->is_error) {
    print '<database-server-error>' . $response->as_string . '</database-server-error>\n';
    return;
}

my $xpathc = XML::LibXML::XPathContext->new;
$xpathc->registerNs('dbman', 'http://marklogic.com/manage/databases');

# extract the appservers
my $dbrels = XML::LibXML->load_xml(string => $response->content);
my @servers = map {
      $_->textContent
    } $xpathc->find(
        '/dbman:database-default/dbman:relations/dbman:relation-group[dbman:typeref = "servers"]/dbman:relation/dbman:nameref',
        $dbrels
        )->get_nodelist;
$dbrels = undef;

# save a snapshot for the current date
my ($sec,$min,$hour,$mday,$mon,$year,$wday,$yday,$isdst) = localtime(time);
my $snapshotFile = 'snapshots-' . $dbname . '-' . ($year + 1900) . '-' . ($mon + 1) . '-' . $mday . '.xml';
open(SNAPSHOT, "> $snapshotFile") || die("can't open snapshot:  $!");
print SNAPSHOT '<?xml version="1.0" encoding="utf-8"?>', "\n";
print SNAPSHOT '<database-server-status>', "\n";
# get the database status
print SNAPSHOT
    $useragent->request(GET 'http://' . $hostport . '/manage/v1/databases/' . $dbname . '/status')->content;
# for the appservers
foreach $server (@servers) {
    # get the appserver status
    print SNAPSHOT
        $useragent->request(GET 'http://' . $hostport . '/manage/v1/servers/' . $server . '/status?group-id=Default')->content;
}
print SNAPSHOT '</database-server-status>', "\n";
close SNAPSHOT;

print $snapshotFile, "\n";

1;
__END__
The client logic that uses the RESTful endpoints hasn’t changed. She just has to add the call that checks in the saved snapshot. That meets the versioning requirements, but she can still use the XML archive to search old snapshots. With snapshots on the results of development activity in place, however, she has to get back to that glitch in the controller for the air conditioning
system (or no one will stay through the afternoon).
Summary
Ted and Jill have made big progress in a short time. Ted set up the development team so they could find configuration and status information on their own, taking the admins out of the loop. He also met his requirements for enterprise monitoring of the production system. Jill knocked out a solution for her requirement, writing a RESTful client that collected the snapshots that she need to track over time.
Leaving Ted and Jill, the story picks up in your own environment. With the tools and APIs of MarkLogic in hand, you can start simplifying and improving management of your own cluster.