MarkLogic version 10.0-4 and higher supports attaching debuggers to requests. The Visual Studio Code (VS Code) editor offers a plug-in architecture to extend the functionality. A community-supported GitHub project offers a Visual Studio Debugger extension for Visual Studio Code. This project is available in the Visual Studio Code Marketplace as the MarkLogic developer tools extension.
Let’s learn about using Visual Studio Code with the MarkLogic Visual Studio Code Extension to debug a JavaScript Module in MarkLogic.
Get Started
This tutorial is designed so you can follow along and get hands-on with debugging MarkLogic modules written in JavaScript. To do so you will need to setup a few (free) things on your machine:
- MarkLogic awesomeness: MarkLogic Server 10.0-4 (or later). You’ll need to get it installed and initialized. Check out these resources to learn how:
- Visual Studio Code
- How to install and configure
- Configure VS Code settings to associate MarkLogic *.sjs files as JavaScript.
Now that you’ve got your local environment setup, let’s begin the tutorial.
Add the MarkLogic Extension to VS Code
Once Visual Studio Code is installed on your computer, we’ll add the MarkLogic developer tools extension and configure it.
- Start the Visual Studio Code application.
- In the Activity Bar on the left side of the window, click on the icon for Extensions:

- In the “Search Extensions in Marketplace” edit box, type marklogic then press ENTER.
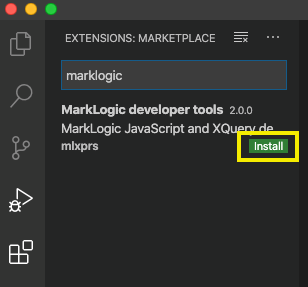
- Click the Install button.
- When the MarkLogic developer tools extension has installed, the Install button will change to a “gear” icon to configure the extension.
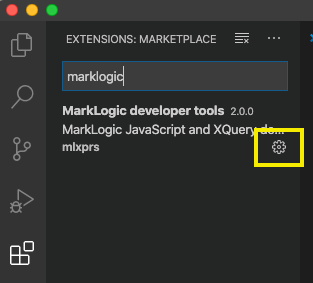
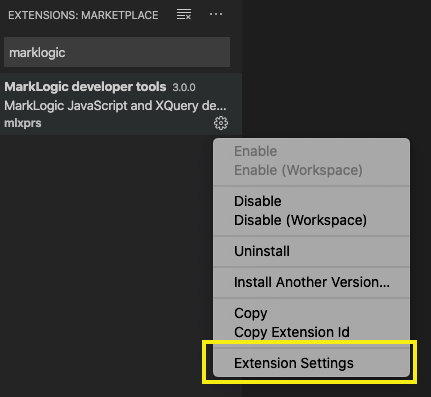
- Click the “gear” icon, then select the Extension Settings menu item.
- In the Settings for the MarkLogic developer tools extension, note the following User and Workspace. For the purposes of this tutorial, you’ll only need the MarkLogic administrator username and password for your MarkLogic instance running on your computer.
- Set the MarkLogic username and password to your local administrator account. Also, set Documents Db to “Documents” and Modules Db to “Modules”. These settings can also be overridden by settings within each JavaScript request. We’ll see an example shortly! See the Visual Studio Code documentation to learn more about User versus Workspace settings.
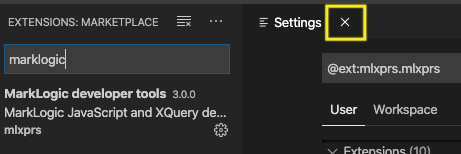
- Close the Settings window by clicking the x.
Create a Project Folder
We’ll create a folder to use for our tutorial. Along with the new folder, we’ll also create a launch configuration file for Visual Studio Code. Visual Studio Code documentation has information about debugging and launch configurations.
- In the Activity Bar, click the Explorer icon in Visual Studio Code.

- Create a folder on your desktop called
MarkLogic Tutorial. - In Visual Studio Code, add the new folder (File -> Add Folder to Workspace…).
- Change to the Run icon in the Activity Bar.
- If you do not yet have a launch configuration, the following is displayed.
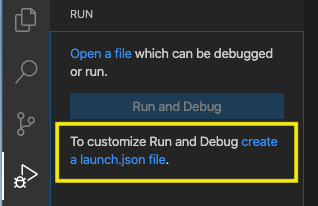
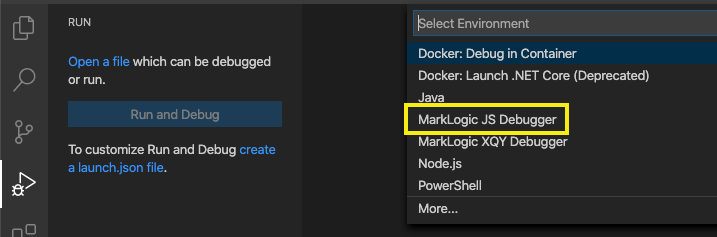
- Click on the create a launch.json file link and select MarkLogic JS Debugger for the environment. This creates a new
launch.jsonfile within a.vscodefolder inside your project folder.
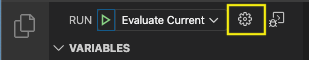
- If you do have a launch configuration, click the “gear” icon to edit the
launch.jsonfile.
- The
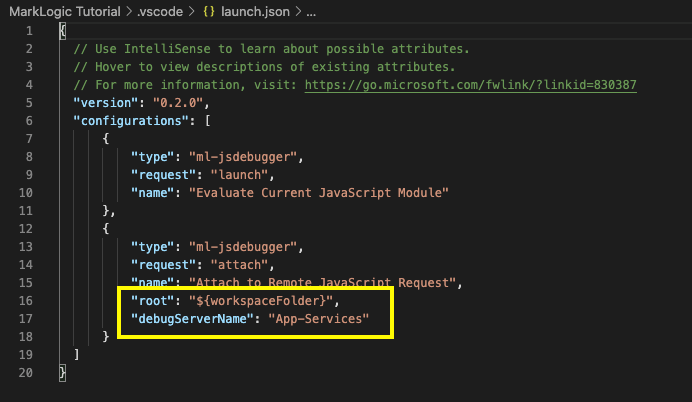
launch.jsonconfiguration file is displayed. - Ensure your configuration appears as shown below, noting that you will need to change the debugServerName property to “App-Services“.
{ // Use IntelliSense to learn about possible attributes. // Hover to view descriptions of existing attributes. // For more information, visit: https://go.microsoft.com/fwlink/?linkid=830387 "version": "0.2.0", "configurations": [ { "type": "ml-jsdebugger", "request": "launch", "name": "Evaluate Current JavaScript Module" }, { "type": "ml-jsdebugger", "request": "attach", "name": "Attach to Remote JavaScript Request", "root": "${workspaceFolder}", "debugServerName": "App-Services" } ] } - Save your changes to the
launch.jsonfile.
Test and Debug JavaScript
You should be able to log into MarkLogic’s Admin interface by going to http://localhost:8001 in your browser and using the MarkLogic username and password you supplied in the Visual Studio Code Settings. Now would be a great time to verify!
With our connection tested, we can do a quick JavaScript test.
- Click the Explorer icon in Visual Studio Code.
- Create a new file in Visual Studio Code (File -> New File).
- Save the file to your
MarkLogic Tutorialproject folder asmytest.sjs(File -> Save As…). - Copy the following JavaScript and paste into the
mytest.sjseditor window./* This example is meant to demonstrate debugging JavaScript modules using the MarkLogic developer tools extension for Microsoft's Visual Studio Code. */ 'use strict'; const myvar = "this is my first test~"; myvar;
- Save the
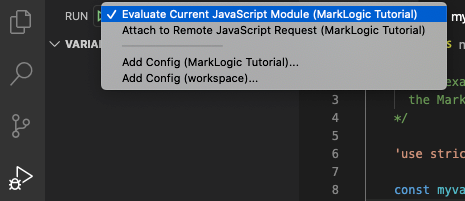
mytest.sjsfile (File -> Save). - Change to the Run icon in the Activity Bar.
- In the Run context dropdown, select Evaluate Current JavaScript Module (MarkLogic Tutorial).
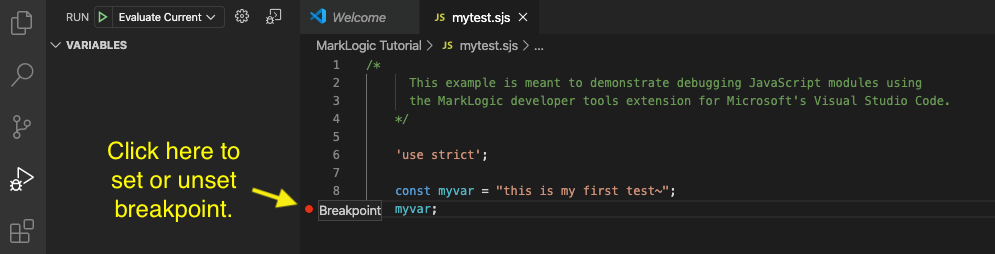
- In the editor window for
mytest.sjs, set a breakpoint on themyvar;line of code.
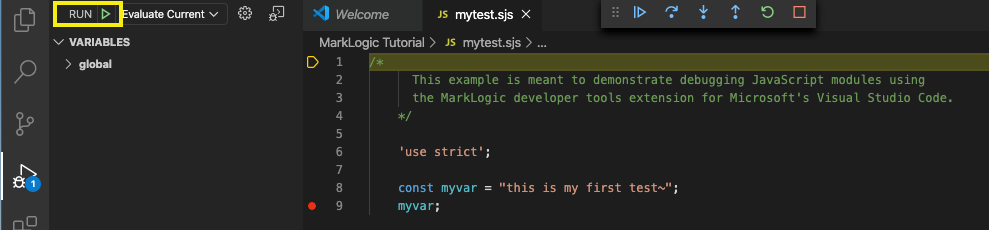
- Click the Run arrow to begin debugging. The debugger will stop on the first line.
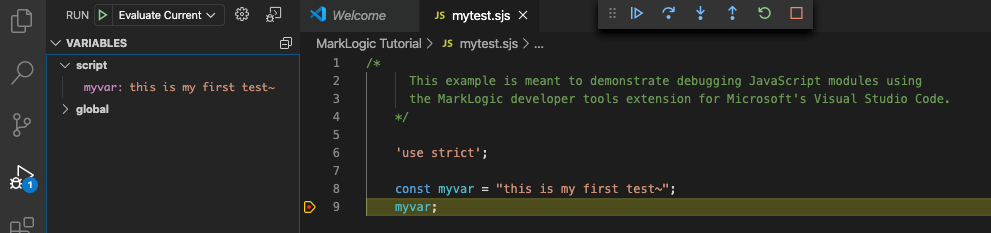
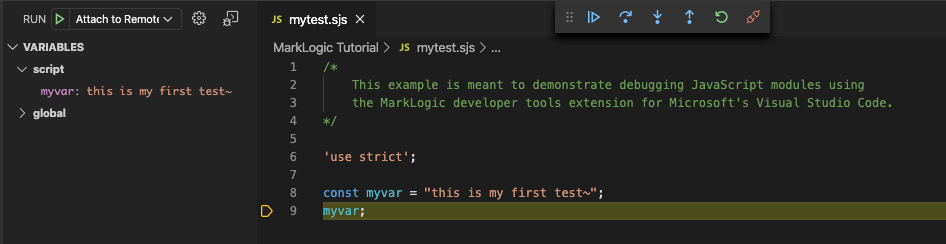
- Use the controls at the top of the code window or under the Run menu to skip to our breakpoint. Note that the VARIABLES window on the left displays our script constant
myvarand its value.
- Continue to explore or simply stop debugging.
Attach to Requests
JavaScript and XQuery modules in MarkLogic are stored in databases, just like your content. This protects your modules, permitting only those that have permissions to run them. Modules run on MarkLogic application servers, implementing Data Services and other functionality closest to the data.
When requests are made, MarkLogic Server 10.0-4 and greater can pause these requests, permitting a debugger to attach to the requests and examine them. To debug these requests with Visual Studio Code, you must have the code both in a MarkLogic database and on your local filesystem, opened in Visual Studio Code. Currently, streaming module code from MarkLogic to Visual Studio isn’t supported.
Let’s use our previous example. We’ll load the mytest.sjs module into a MarkLogic database. Then we’ll attach to a MarkLogic application server and send a request to MarkLogic to run the mytest.sjs module and debug it!
Setup Your Environment
We’re going to use a MarkLogic application server that’s already listening for requests when MarkLogic is installed. In addition, you’ll need the following.
- curl to execute some HTTP requests to MarkLogic
- Your MarkLogic administrator username and password
Currently, our launch.json debugger configuration in Visual Studio contains a debugger type of ml-jsdebugger and a request of attach. Also, your configuration contains the following values for root and debugServerName:
The root is the local path to the JavaScript module code that is also stored in MarkLogic database. This is where our local copy of mytest.sjs is found. The debugServerName is the name of the MarkLogic application server that calls the JavaScript module. In this example, we’ll use one of MarkLogic’s default application servers called App-Services, listening on port 8000. These were copied into your launch.json Visual Studio Code debugger configuration earlier in this tutorial, therefore no changes are needed to be made right now.
Load the mytest.sjs Module
The following curl command loads our mytest.sjs to the Modules database, a default database created in MarkLogic where the App-Services MarkLogic application server looks for code modules.
curl --anyauth --user admin:admin -X PUT -T ./mytest.sjs -H "Content-type: application/vnd.marklogic-javascript" "http://localhost:8000/LATEST/documents?uri=/mytest.sjs&database=Modules"
Note that MarkLogic has a preferred method of managing and deploying Data Hub projects and Data Services. We use ml-gradle tasks, added as a plugin to the Gradle build system. In real world project using the MarkLogic Data Hub and running on the MarkLogic Data Hub Service in the cloud you would use ml-gradle for complete deployment automation and configuration management.
But for the purposes of this tutorial, we’ll use MarkLogic’s REST API to load our code.
- Edit the above command and change the value of the curl
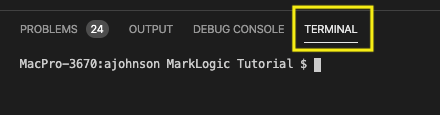
--userargument fromadmin:adminto your MarkLogic administrator user name and password. Make sure you separate the user and password with a colon (:). - Open a command prompt (Windows) or terminal window (MacOS or Linux). Alternatively, did you know Visual Studio Code can run a Terminal session for you, right in Visual Studio Code? Try it! (View -> Terminal)
- Paste the edited curl command to the command or terminal prompt.

- Press ENTER to send the curl command to MarkLogic.
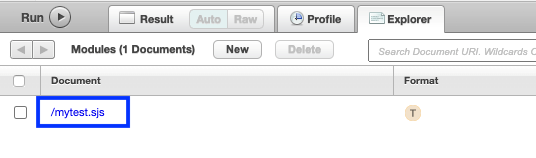
- Verify that the
mytest.sjsmodule has been loaded into a MarkLogic database by going to port 8000 in a browser on your MarkLogic server to access Query Console. - Log in with your MarkLogic administrator credentials.
- Set the Database dropdown to Modules then click the Explore button to the right of the Database dropdown list.
- Click the Explore button to the right of the Database dropdown list.
In the output area of Query Console, see the mytest.sjs module listed.
Connect to a MarkLogic Debug Server
We need to let the MarkLogic App-Services application server know we are going to attach a debugger to any request it has queued. The App-Services application server, by default, enables debugging on this application server. We need to connect to the App-Services application server from Visual Studio Code, which will pause any request received after we have connected to that application server.
- Open the Visual Studio Code command palette (View -> Command Palette…).
- Enter MarkLogic: which should bring up a list of commands supported by the MarkLogic extension.
- Select MarkLogic: Connect JavaScript Debug Server.
- In the edit box, type in App-Services then press ENTER.
 The MarkLogic extension confirms that you are attached to the application server in the message area of Visual Studio Code (lower right part of the window):

Debug a JavaScript Request
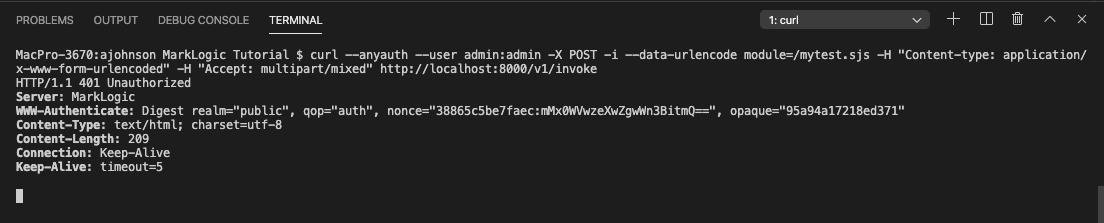
The following curl command sends a request to MarkLogic. The request executes our mytest.sjs in the App-Services MarkLogic application server.
curl --anyauth --user admin:admin -X POST -i --data-urlencode module=/mytest.sjs -H "Content-type: application/x-www-form-urlencoded" -H "Accept: multipart/mixed" http://localhost:8000/v1/invoke
- Edit the above command and change the value of the curl
--userargument fromadmin:adminto your MarkLogic administrator user name and password. Make sure you separate the user and password with a colon (:). - Open a command prompt (Windows) or terminal window (MacOS or Linux), or use the Visual Studio Terminal window.
- Paste the edited curl command to the command or terminal prompt.

- Press ENTER to send the curl command to MarkLogic. The App-Services application server pauses the request, waiting for us to attach our Visual Studio Code debugger.
- Open
mytest.sjsin a new editor window from the Visual Studio Code Explorer. - In Visual Studio Code, change the debugger launch configuration to the Attach to Remote JavaScript Request (MarkLogic Tutorial).
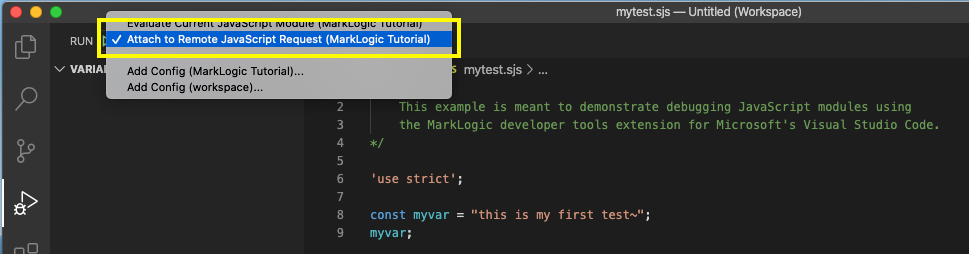
- Run the Visual Studio Code debugger with the Attach to Remote JavaScript Request option.
- You are prompted to select one of any currently paused requests. We’ve only made a single request (to run our
mytest.sjsmodule) so only one request should be listed.
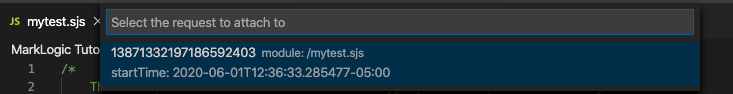
- Click the paused request in the list. The debugger in Visual Studio Code should start for your local copy of
mytest.sjsand stop at the first line. - Step through the code and examine the variables, as desired.
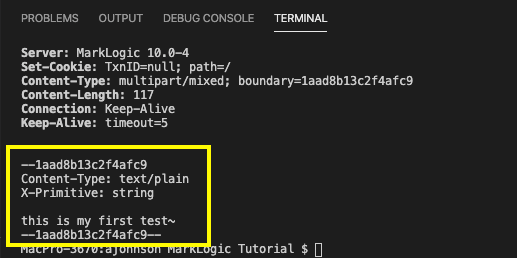
- After debugging, note any returned results from your module displays in your terminal or command line window.
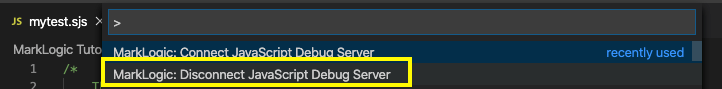
Remember to disconnect from a MarkLogic application server once you have finished debugging. Otherwise, additional requests will be paused unnecessarily in MarkLogic. If not attached to in the Visual Studio Code debugger, these paused requests will eventually continue. To disconnect from the App-Services application server, display the Command Palette window again (View -> Command Palette…) and select MarkLogic: Disconnect JavaScript Debug Server from the list of MarkLogic commands.
 A message from the MarkLogic developer tools confirms you are disconnected from the App-Services application server.
![]()
Delete the mytest.sjs Module
The following curl command deletes the mytest.sjs module from the Modules database.
curl --anyauth --user admin:admin -X DELETE "http://localhost:8000/LATEST/documents?uri=/mytest.sjs&database=Modules"
- Edit the above command and change the value of the curl
--userargument fromadmin:adminto your MarkLogic administrator user name and password. Make sure you separate the user and password with a colon (:). - Open a command prompt (Windows) or terminal window (MacOS or Linux), or use the Visual Studio Terminal window.
- Paste the edited curl command to the command or terminal prompt.
- Press ENTER to send the curl command to MarkLogic and remove the
mytest.sjsJavaScript module from the Modules MarkLogic database.